Oil and gas exploration began in UK waters in 1965. Since that time 44 billion barrels of oil and gas equivalent have been extracted, 7,800 wells have been drilled and the industry’s operations pepper vast regions of the North Sea.
Unlike coal or on-shore renewables, this major industrial activity goes far away from communities and most people’s daily lives. To most people it is invisible.
![]()
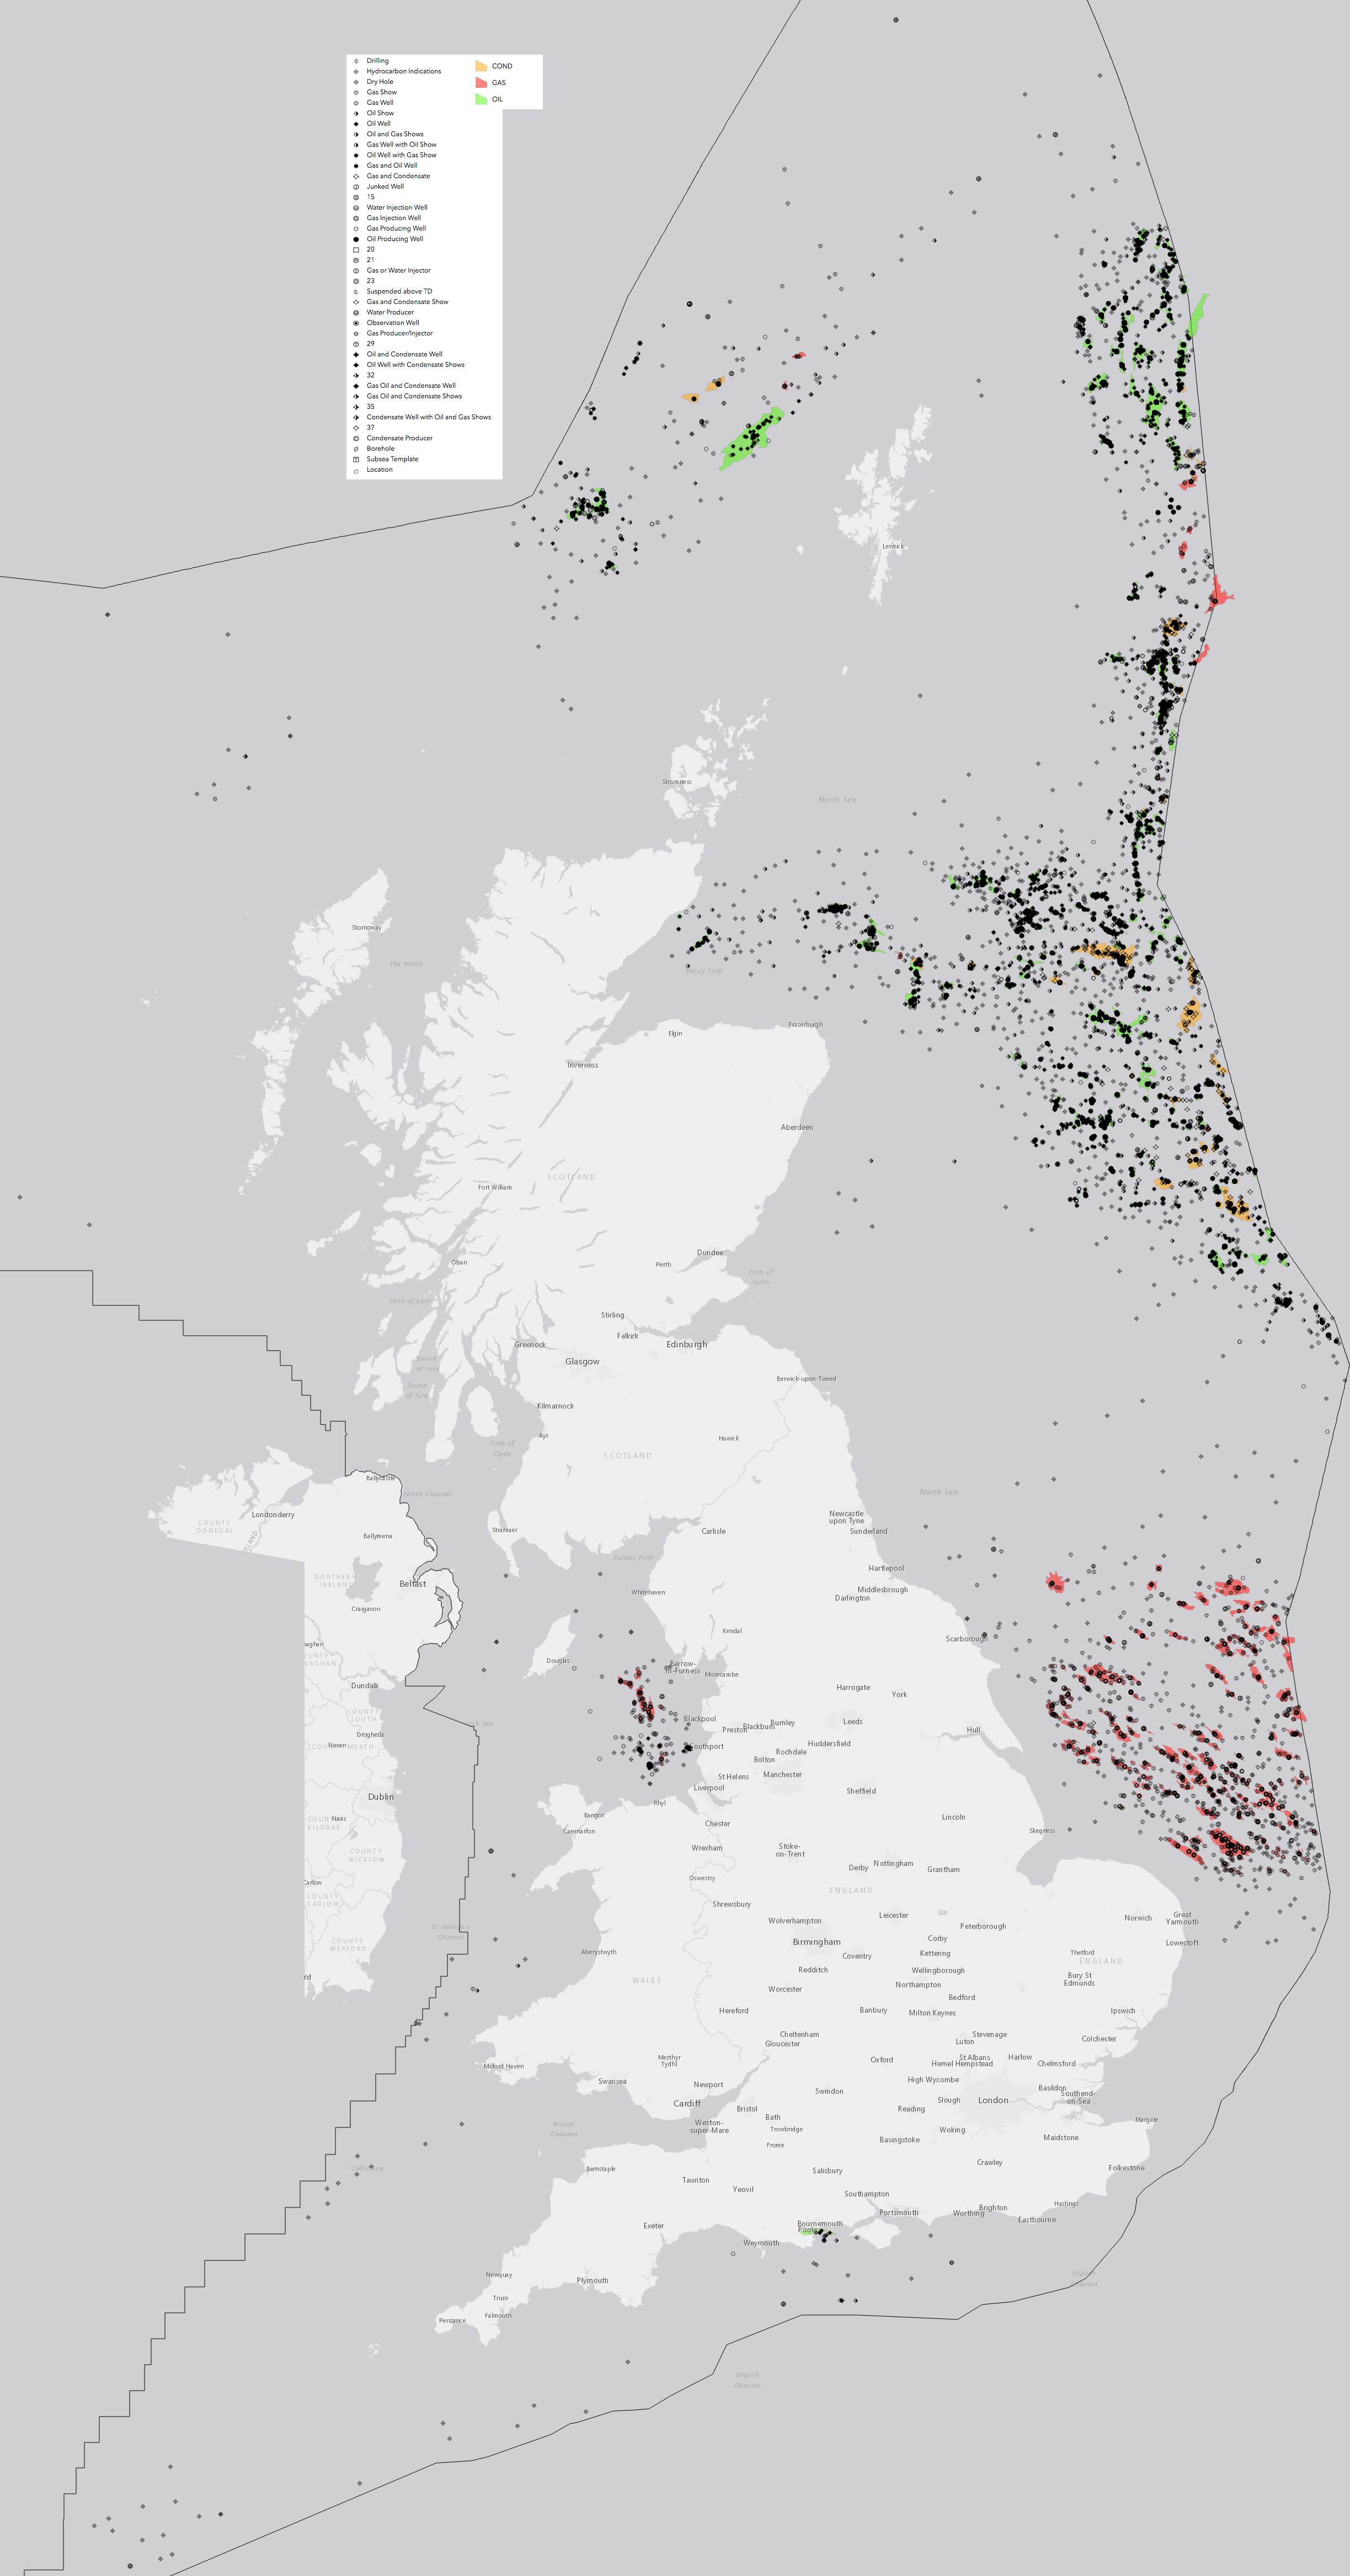
To more clearly visualise the scale and breadth of the UK’s oil and gas industry I have taken the UK Government’s official map of drilled wells and applied filters to show the fossil fuel producing ‘regions’ of the sea, shown in black.
You can click on the maps to see more detail. You are also very welcome to adapt them for your own projects.
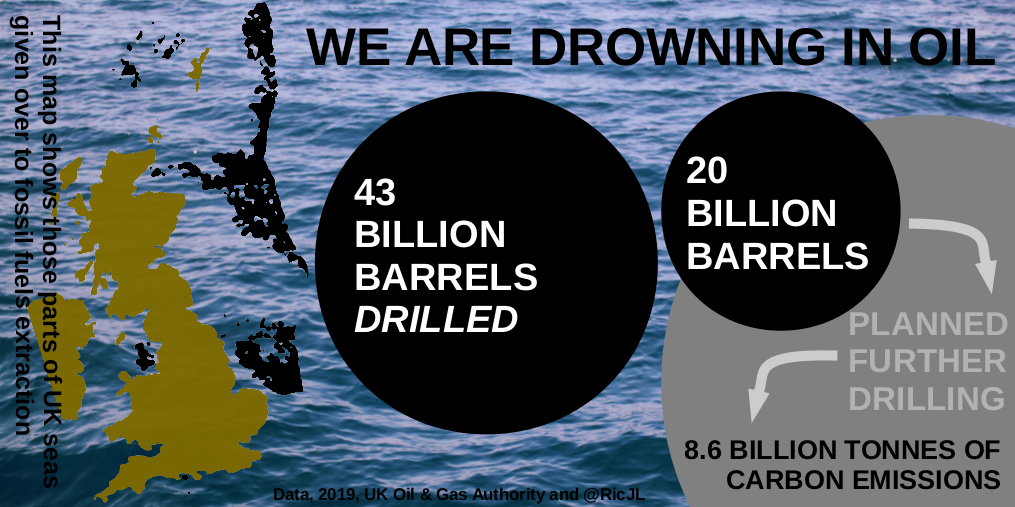
I also made this sharable image for social media.
Notes:
- The map was extracted from the UK Oil & Gas Authority’s ‘Offshore Interactive Map’ on 18 March 2019. You’ll notice the mapping has been changed slightly since this time – but the underlying data should be the same.
- The number 43 billion was correct as of March when this was first tweeted. The up-to-date figure is 44 billion, according to the UK Government.
Leave a Reply